Production Analysis and Comparison
Jan 28, 2022Now that we're into the new year, it's a great time to review practice production from 2021 and past years. Your practice can benefit from knowing the breakdown of treatment completed and can help in establishing areas to focus on and grow.
The Production Analysis provides a detailed account of transactions posted in a specific date range. This report allows you to see each type of transaction, categories of procedures, and compare to a previous date range.
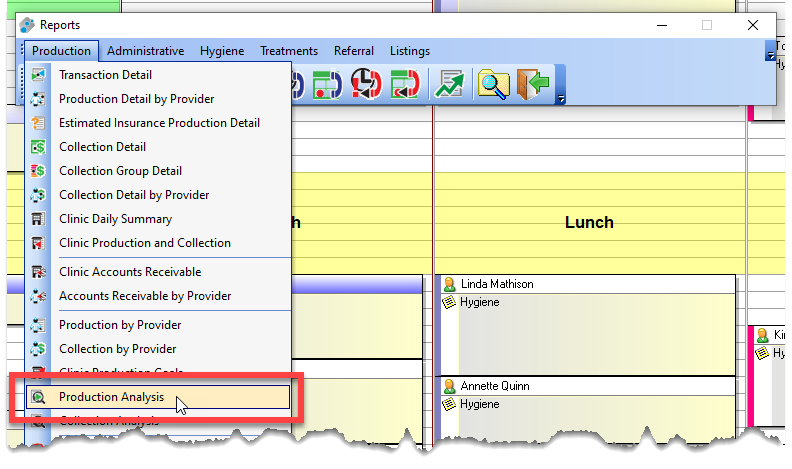
To start, access Reports -> Production -> Production Analysis.

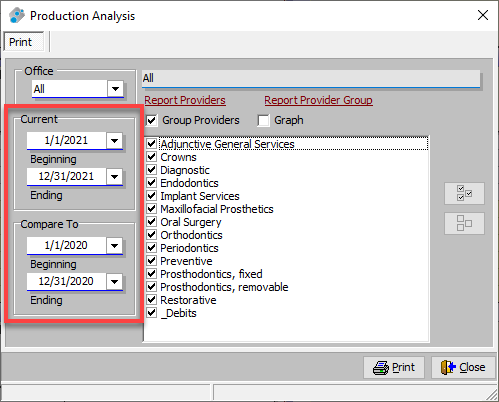
The date ranges can be entered for the current period and a comparison. Any date range can be used. In this example, we'll compare all of 2021 to 2020. The report can be run for the practice as a whole or selected providers, with additional options for including a graph and selected types of services.

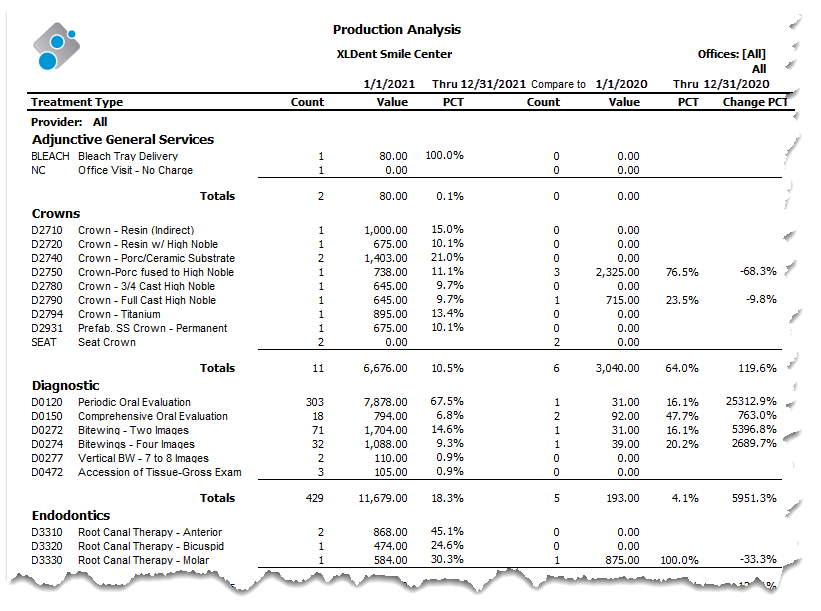
The report has the total value for each code, along with totals for each Treatment/Debit Type. Percentages reflect the total value of Treatment Codes compared to Treatment Type, and Treatment Type totals compared to the full report total. A comparison percentage shows the change between the compared and current period.

An innovative treatment Chart which allows for all information to be displayed on one screen for easy viewing.
Stores images from any digital imaging device and integrates them seamlessly to each patient's chart.
Patient and Doctor Portals provide secure internet-based access to the information they want, when they want it.
This flexible, easy to use program tracks employee hours effortlessly. Simple to install on one or multiple computers.


